Monday, November 13, 2006
FAQ #5
Q: I heard that there is almost no demand for whale meat in Japan, and that demand is declining?
A: Analysis of official stockpile figures gives a very different perspective.
In contrast to what is frequently reported in the media, official frozen marine product stockpile figures from The Ministry of Agriculture, Forestry and Fisheries of Japan indicate that whale meat consumption has actually been rising annually in all years for which figures are currently available. Prices also remain relatively high compared to other meat products.
Furthermore, the majority of these recent increases has occurred within the private sector, as opposed to non-profit activities.
Statements that have appeared in the media suggesting that demand is falling incorrectly interpret increasing peak stockpile levels as indicating a lack of market demand. Demand trends cannot be derived solely by observing stockpile levels, as the peak level of the stockpiles is also influenced heavily by supply.
A noteworthy feature of whale meat supply to the Japanese market is that it is seasonal in nature (whereas demand is more constant throughout the year). Currently the main supplies of whale meat arrive at the conclusion of Japan's whale research programmes, which include lethal research components in accordance with Article VIII of the International Convention for the Regulation of Whaling. The whale meat by-products resulting from these programmes (the proceeds of which are partially used to offset the research costs) reach the stockpiles in early Spring and Autumn, which results in the stockpiles of whale meat peaking at these times. The meat from JARPA typically goes on sale around July, and the meat from JARPN typically goes on sale around December.
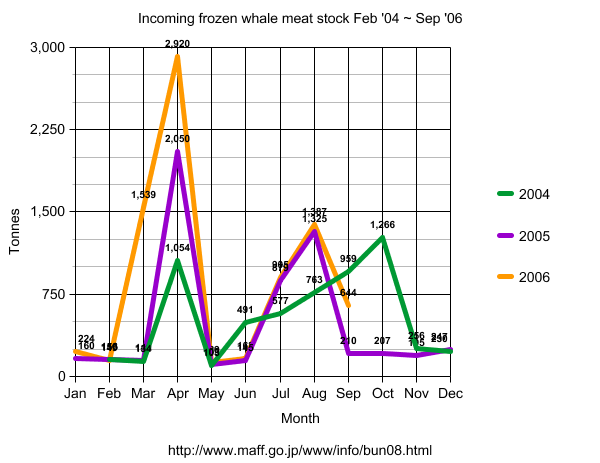
The following graph shows incoming whale meat shipments from February 2004 through to September 2006:

* Regular updates to this graph will be available here.
In recent years, total annual supply of whale meat has increased significantly compared to the 1990's due mainly to expansion of research programmes. As a result, frozen whale meat stocks have naturally peaked at higher levels.
For example, the stockpile peaked at 4539 tonnes in April 2005, and at 5969 tonnes in April 2006 - a 1430 tonne increase, year on year. This coincided with the commencement of the JARPA II research programme in the Antarctic during the austral summer, in which the number of whales taken increased significantly compared to the original JARPA programme.
ICR press releases show that 1,895.1 tonnes of whale meat (from 440 Antarctic minke whales) was put on the market following the conclusion of JARPA in 2005, and 3,435.8 tonnes for the first year of JARPA II in 2006 (from 853 Antartic minke and 10 fin whales). The difference in supply from JARPA between 2005 and 2006 was thus 1540.7 tonnes - slightly more than the difference in level of stockpiles for April in each year.
The increase in the peak size of the stockpiles is clearly influenced heavily by supply.
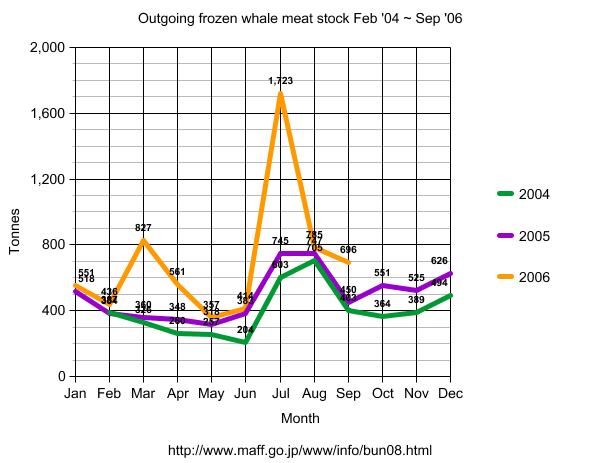
Actual demand trends are indicated not by peak stockpile sizes, but more accurately by volumes of frozen whale meat stock shipped out of warehouses, which is an indicator of consumption. These volumes have generally been increasing each year, which reconciles with recent Japanese business media reports of significant increases in sales, through supermarkets and restaurant chains (as much as 50% in some cases).
The following graph showing outgoing whale meat shipments from February 2004 through to September 2006 indicates this:
* Regular updates to this graph will be available here.
From 2007/2008 onwards, levels of supply from research programmes will again stabilise due to the full commencement of the JARPA II research programme, which will cap further increases in consumption.
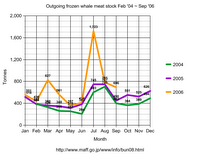
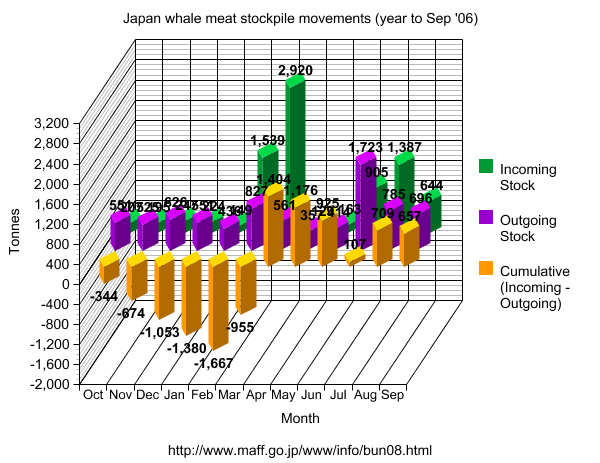
At the time of writing, the increases in incoming stocks for the year to September 2006 are greater than increases in outgoing stocks by several hundred tonnes. The following graph shows the gap between incoming stocks and outgoing stocks for the year from October 2005 to September 2006:
 * Regular updates to this graph will be available here.
As shown in the graph, the gap is 657 tonnes. Put it into perspective, 657 tonnes is equivalent to 7.3% of incoming stocks and 7.7% of outgoing stocks for the period.
The increasing trend in consumption suggests that by February 2007 the level of stocks remaining in frozen storage will likely be lower than compared to the same time in 2006 and 2005.
Another demand indicator is prices. Prices have come down significantly from their peak in the 1990's when supply was even more limited than at the present time, however today whale meat remains an expensive option compared to substitutes such as beef and pork, despite whale meat traditionally having a "poor man's" image. The wholesale price of whale meat is currently around 1950 yen per kilogram, and actual consumer prices are often 2 or 3 times as high.
Figures released by the Institute of Cetacean Research show that only a small proportion of the additional whale meat from was set aside for non-profit uses, such as distribution in traditional whaling communities and school lunches.
 * Sourced from ICR press releases:
Sale of JARPA by-products (2002, 2003, 2004, 2005, 2006)
Sale of JARPN by-products (2002, 2003, 2004, 2005, 2006)
These figures indicate that increases in private consumption have been the primary factor in overall increases in whale meat consumption, not non-profit activities.
Recent increases in private consumption, while prices remain relatively high, indicate that demand for whale meat in Japan remains strong.
Official figures obtained from the ministry homepage (http://www.maff.go.jp/www/info/bunrui/bun06.html) used to produce the graphs in this FAQ are as follows:
¶ 4:04 AM
A: Analysis of official stockpile figures gives a very different perspective.
Overview
In contrast to what is frequently reported in the media, official frozen marine product stockpile figures from The Ministry of Agriculture, Forestry and Fisheries of Japan indicate that whale meat consumption has actually been rising annually in all years for which figures are currently available. Prices also remain relatively high compared to other meat products.
Furthermore, the majority of these recent increases has occurred within the private sector, as opposed to non-profit activities.
Misconception
Statements that have appeared in the media suggesting that demand is falling incorrectly interpret increasing peak stockpile levels as indicating a lack of market demand. Demand trends cannot be derived solely by observing stockpile levels, as the peak level of the stockpiles is also influenced heavily by supply.
A noteworthy feature of whale meat supply to the Japanese market is that it is seasonal in nature (whereas demand is more constant throughout the year). Currently the main supplies of whale meat arrive at the conclusion of Japan's whale research programmes, which include lethal research components in accordance with Article VIII of the International Convention for the Regulation of Whaling. The whale meat by-products resulting from these programmes (the proceeds of which are partially used to offset the research costs) reach the stockpiles in early Spring and Autumn, which results in the stockpiles of whale meat peaking at these times. The meat from JARPA typically goes on sale around July, and the meat from JARPN typically goes on sale around December.
Supply
The following graph shows incoming whale meat shipments from February 2004 through to September 2006:
* Regular updates to this graph will be available here.
In recent years, total annual supply of whale meat has increased significantly compared to the 1990's due mainly to expansion of research programmes. As a result, frozen whale meat stocks have naturally peaked at higher levels.
For example, the stockpile peaked at 4539 tonnes in April 2005, and at 5969 tonnes in April 2006 - a 1430 tonne increase, year on year. This coincided with the commencement of the JARPA II research programme in the Antarctic during the austral summer, in which the number of whales taken increased significantly compared to the original JARPA programme.
ICR press releases show that 1,895.1 tonnes of whale meat (from 440 Antarctic minke whales) was put on the market following the conclusion of JARPA in 2005, and 3,435.8 tonnes for the first year of JARPA II in 2006 (from 853 Antartic minke and 10 fin whales). The difference in supply from JARPA between 2005 and 2006 was thus 1540.7 tonnes - slightly more than the difference in level of stockpiles for April in each year.
The increase in the peak size of the stockpiles is clearly influenced heavily by supply.
Demand and consumption
Actual demand trends are indicated not by peak stockpile sizes, but more accurately by volumes of frozen whale meat stock shipped out of warehouses, which is an indicator of consumption. These volumes have generally been increasing each year, which reconciles with recent Japanese business media reports of significant increases in sales, through supermarkets and restaurant chains (as much as 50% in some cases).
The following graph showing outgoing whale meat shipments from February 2004 through to September 2006 indicates this:
* Regular updates to this graph will be available here.
From 2007/2008 onwards, levels of supply from research programmes will again stabilise due to the full commencement of the JARPA II research programme, which will cap further increases in consumption.
Stockpile Fluctuation
At the time of writing, the increases in incoming stocks for the year to September 2006 are greater than increases in outgoing stocks by several hundred tonnes. The following graph shows the gap between incoming stocks and outgoing stocks for the year from October 2005 to September 2006:
 * Regular updates to this graph will be available here.
As shown in the graph, the gap is 657 tonnes. Put it into perspective, 657 tonnes is equivalent to 7.3% of incoming stocks and 7.7% of outgoing stocks for the period.
The increasing trend in consumption suggests that by February 2007 the level of stocks remaining in frozen storage will likely be lower than compared to the same time in 2006 and 2005.
Prices
Another demand indicator is prices. Prices have come down significantly from their peak in the 1990's when supply was even more limited than at the present time, however today whale meat remains an expensive option compared to substitutes such as beef and pork, despite whale meat traditionally having a "poor man's" image. The wholesale price of whale meat is currently around 1950 yen per kilogram, and actual consumer prices are often 2 or 3 times as high.
Use in non-profit activities
Figures released by the Institute of Cetacean Research show that only a small proportion of the additional whale meat from was set aside for non-profit uses, such as distribution in traditional whaling communities and school lunches.
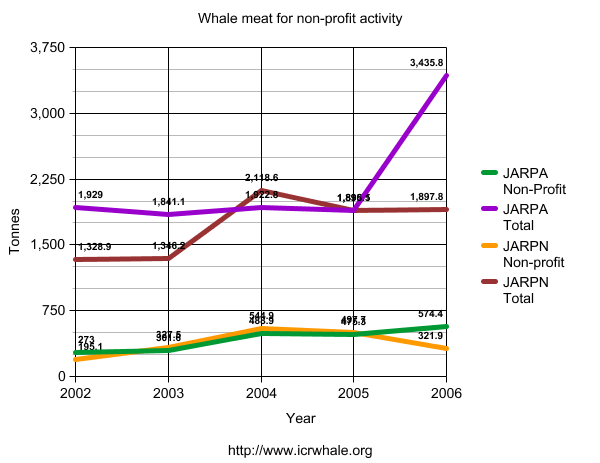 * Sourced from ICR press releases:
Sale of JARPA by-products (2002, 2003, 2004, 2005, 2006)
Sale of JARPN by-products (2002, 2003, 2004, 2005, 2006)
These figures indicate that increases in private consumption have been the primary factor in overall increases in whale meat consumption, not non-profit activities.
Conclusion
Recent increases in private consumption, while prices remain relatively high, indicate that demand for whale meat in Japan remains strong.
* * *
Official figures obtained from the ministry homepage (http://www.maff.go.jp/www/info/bunrui/bun06.html) used to produce the graphs in this FAQ are as follows:
| Month | Stockpile size at previous month end | Incoming stock | Outgoing stock | Stockpile size at month end |
| Feb '04 | 2040 | 156 | 387 | 1809 |
| Mar '04 | 1809 | 134 | 326 | 1617 |
| Apr '04 | 1614 | 1054 | 260 | 2408 |
| May '04 | 2408 | 103 | 257 | 2254 |
| Jun '04 | 2254 | 491 | 204 | 2541 |
| Jul '04 | 2541 | 577 | 603 | 2515 |
| Aug '04 | 2515 | 763 | 705 | 2573 |
| Sep '04 | 2573 | 959 | 403 | 3129 |
| Oct '04 | 3129 | 1266 | 364 | 4031 |
| Nov '04 | 4031 | 256 | 389 | 3898 |
| Dec '04 | 3898 | 230 | 494 | 3634 |
| Jan '05 | 3634 | 160 | 518 | 3276 |
| Feb '05 | 3276 | 156 | 384 | 3048 |
| Mar '05 | 3048 | 149 | 360 | 2837 |
| Apr '05 | 2837 | 2050 | 348 | 4539 |
| May '05 | 4539 | 109 | 318 | 4330 |
| Jun '05 | 4330 | 145 | 383 | 4092 |
| Jul '05 | 4092 | 879 | 745 | 4226 |
| Aug '05 | 4226 | 1325 | 747 | 4804 |
| Sep '05 | 4804 | 210 | 450 | 4564 |
| Oct '05 | 4562 | 207 | 551 | 4220 |
| Nov '05 | 4220 | 195 | 525 | 3890 |
| Dec '05 | 3890 | 247 | 626 | 3511 |
| Jan '06 | 3512 | 224 | 551 | 3185 |
| Feb '06 | 3185 | 149 | 436 | 2898 |
| Mar '06 | 2898 | 1539 | 827 | 3610 |
| Apr '06 | 3610 | 2920 | 561 | 5969 |
| May '06 | 5969 | 129 | 357 | 5741 |
| Jun '06 | 5741 | 163 | 414 | 5490 |
| Jul '06 | 5490 | 905 | 1723 | 4672 |
| Aug '06 | 4672 | 1387 | 785 | 5274 |
| Sep '06 | 5274 | 644 | 696 | 5222 |
| Oct '06 | 5222 | 233 | 493 | 4962 |
| Nov '06 | 4962 | 349 | 908 | 4403 |
| Dec '06 | 4403 | 308 | 807 | 3904 |
| Jan '07 | 3904 | 462 | 1001 | 3365 |
| Feb '07 | 3365 | 397 | 601 | 3161 |
| Mar '07 | 3161 | 2159 | 730 | 4590 |
| Apr '07 | 4590 | 278 | 464 | 4404 |
* all figures in tonnes
¶ 4:04 AM
Comments:
<< Home
Thank you so much, I am an American Researcher and have been trouble finding this information in Japanese website. Many thanks. Please be aware I may ask you some more questions regarding where you got your data from. Thank you

The information is from part of a monthly survey conducted by the Ministry of Agriculture, Forestry and Fisheries. The survey looks at all sorts of marine products in frozen storage, I extract the whale product info.
Latest updates to the figures can be found here, and the original stats are from www.maff.go.jp, if you can read Japanese.
Post a Comment
Latest updates to the figures can be found here, and the original stats are from www.maff.go.jp, if you can read Japanese.
<< Home